XEvents Repent! or the great Profiler Defiler.
- Rod Edwards
- Aug 23, 2023
- 5 min read
Look, I hate SQL Profiler. I hate its stupid face, I hate its greedy appetite, I hate the way it used to lull us into the false understanding that it was our friend, shortly before hitting us in the face with a shovel and defenestrating us into the bosses office.
If you love profiler, sorry, we can't be friends...Look, its not you...its me...
(Ok, ok, I know is should always be executed server side via SQL Trace, but it spoils the comedy effect of the above)
So a long time ago, Microsoft gave us Extended Events, or XEvents as I love being lazy with syllables. This was lightweight (mostly, when used in the manner directed), fast, wide reaching and generally marvellous. Yes, the GUI to create the Xevent session was a little bewildering to start with due to the range of options, but that was soon learnt, and all was well.
Oh, apart from possibly having to query XML for a chunk of it which remains horrid, and sys.fn_xe_file_target_read_file for reading files (which is ok and still very valid).
Time for XEvent to repent for its sins of being brilliant and powerful, but a little tricky to use quickly. May explain why common uptake was a little slow for it, who knows?
Sometimes though, for fast analysis and insights, a GUI will do just that.
Time to see the light.
I've created an Xevent purely on capturing latch waits, so just the latch_suspect_end event, and saved it to a File. Just to iterate, the examples below are exactly that, there isn't anything wrong with my latches (oooh matron!) , but its just to show how the data can be carved up.
This same method can be performed with anything you've got live data going to the screen, just stop the live loading from the Red 'Stop' button before trying to analysis.

Data looks like that to the left. Nothing spectactular at all to be seen yet, although its not much use to "man 'nee beast" anyway.

Base Data columns look like this to the right this time. All our different Event fields and Actions (why did they call them that?) that we've collected.
OK, so we are only interested in a specific time, no problemo, set a time filter.
Click Filters on the top icon bar.

You have already? Nice!, you're good.
So lets now pimp up our data window by adding additional columns.

Simply right click on the Field that you want to add, then choose 'Show column in Table'
So adding database_id, file_id, page_id, Duration, class, mode and page_type_id will give us the below.

Sorting is by timestamp asc by default. You can easily sort by any column however - just click on the column header as i've done above as an example.
We're now getting a more usable data window with lots of lovely events. Its still a great wall of text though.
So, say you wanted to filter on a specific field? Ie… in this case, If I'm just interesed in database_id 7?
Right click the cell that you want - and Filter by this Value

And it automatically adds the selection to the filter list. You can use this method to quickly build the filter basics, and change it to your requirements. Ie.. If you wanted ALL but database_id 7, then change the equals operator to non equals. <>, its as simple as that.

Great, so we can easily filter. Repeating the above just appends to our filter, so we can quickly build up complicated filters easily.
I want Insights!
Yes, we all do, now calm yourself down.
So we have a whole host of data now, but need to get meaning from it. Question: I want to see which database had the greatest number of latch waits against it?
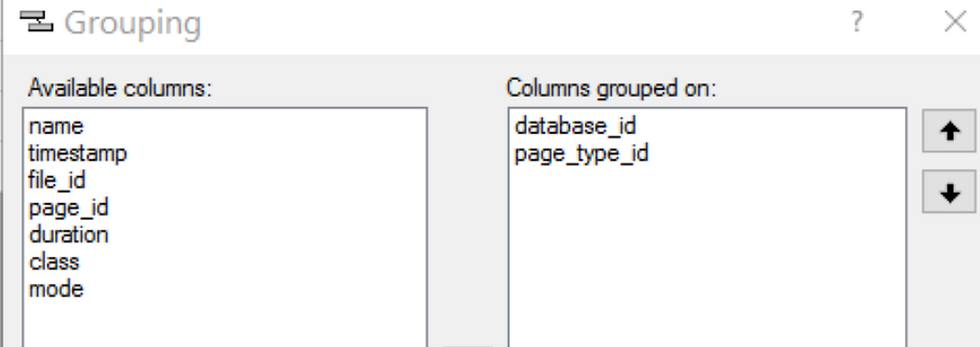
OK, Go to Grouping...


Add database_id to the grouping column pane.

And the data is grouped as requested, with a count of the events within each group .
You can expand it out with the (+) if you'd like to see the detail data rows exactly how they were previously.
Now what we can do now its grouped, is to start applying some basic aggregations to the data.
Lets add SUM to Duration, and order by it too.

The sum of all latch wait durations, simples.
Which will give us an output like below. We've broken down our data really quickly.

Ooh, hello.
I'm seeing usefulness gleaned, all in a few seconds. My latch waits were focused on database_id 8 (i've removed the filter mentioned above btw, before I get more hate mail.)
Question : Can I see which page(s) were the worst offender?
Of course my little band members.

So first, lets add group our data by Database_id and then Page_ID

Now COUNT Aggregrate on name , and lets add SUM on duration so that we can to get the total wait time on each page.
As this allows gives a sorted aggregation - in this case database_id 8, file_id, page_id 3067392 suffered most. And had 22.47 ms of latch waits over this period. Meaningless for this example, but hopefully you can start to see some of the benefits this simple functionality can provide.

Question. I need to see the type of Page that was most prevailent with Latch Waits.
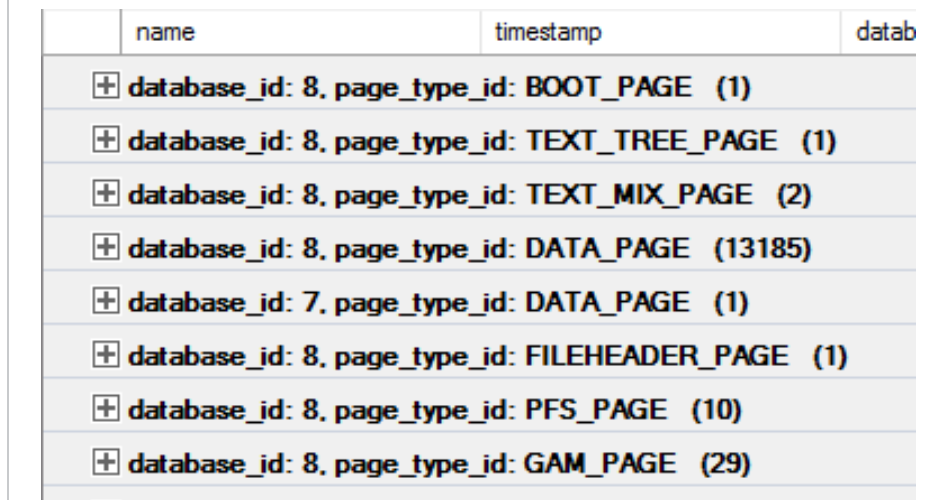
Yarp, no problem. Just group by database_id and page_type_id.

Again, just add a COUNT Aggregate on 'name' and order, if you want to order the resultset.
Ie… if you were concerned that Latch waits you were seeing were Tempdb PFS/GAM etc. The output looks like below, but would show Database ID 2, type of page, count of the latch waits in (brackets). Sorted.

Or Latch type - Group by Database_id and Class. Just Buffer waits here, nothing of any interest.

You've worked it out already, but this can be done with any column that you add to your display window. The data type of the data defines what aggregations are available for it.
The Band Elwood! The Band!
XEvent profiler
(This profiler is the good one)
How easy was that to carve up the data? It even works with the XEvent Profiler output after you've stopped collecting.

1. Start a session for the period you want to capture for.
2. Stop the session, but leave the Live Capture Window open. 3. Filter to name = rpc_completed and sql_batch_completed 4. Group by database_id or database_name
4a. Or Group by session_id 4b. Or nt_username. 5. Aggregate to SUM of CPU 5a. Or Logical_Reads
etc.
See how easy it is to chop up captured data in seconds to see where pain points are?
The Blamethrower is loaded, primed and aimed in record time.
This is one case where the GUI can be wonderfully useful and save a lot of time for analysis. I always like code, but I rather like the Xevent GUI functionality here.
Exporting the data to SQL
Still want to use TSQL, to perform advanced querying and aggregations, but don't want to play with sys.fn_xe_file_target_read_file?
You certainly can. Extended Events > Export to > Table.

1. Connect to the server name you want,
2. Choose a DB and schema,
3. Type or pick the table name as the target.

All Data will then be exported to the table where you can calve up using TSQL as you desire.
That's it! We're now in Chicago, still have some gas, only had time for 1 cigarette and still wearing sunglasses. You could even go and see the Penguin too, as SSMS can manage SQL on Linux.
No police cars were harmed in the creation of this blog post.
Thanks for reading
In Rod we Trust.
gw